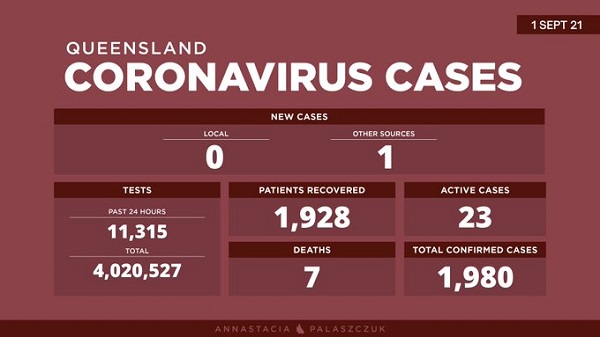
COVID-19 cases in Queensland during August 2021.
The QLD government releases numbers of cases every morning, covering cases recorded in the previous day.
At the end of August 2021 there have been a total of 1,928 confirmed COVID-19 cases since the pandemic began.

This table shows the numbers of those cases, on the days they were recorded.
QLD Daily COVID-19 Cases in August 2021.
Local= Locally Acquired Case
O/seas=Overseas Arrival Case
| August | Local | O/seas | Deaths |
|---|---|---|---|
| 31st | 0 | 1 | 0 |
| 30th | 0 | 0 | 0 |
| 29th | 0 | 2 | 0 |
| 28th | 1 | 0 | 0 |
| 27th | 0 | 4 | 0 |
| 26th | 0 | 1 | 0 |
| 25th | 0 | 2 | 0 |
| 24th | 0 | 0 | 0 |
| 23rd | 2 | 4 | 0 |
| 22nd | 1 | 1 | 0 |
| 21st | 0 | 0 | 0 |
| 20th | 0 | 2 | 0 |
| 19th | 1 | 0 | 0 |
| 18th | 0 | 0 | 0 |
| 17th | 0 | 4 | 0 |
| 16th | 1 | 1 | 0 |
| 15th | 0 | 0 | 0 |
| 14th | 0 | 1 | 0 |
| 13th | 7 | 1 | 0 |
| 12th | 7 | 1 | 0 |
| 11th | 10 | 1 | 0 |
| 10th | 4 | 0 | 0 |
| 9th | 3 | 0 | 0 |
| 8th | 4 | 1 | 0 |
| 7th | 9 | 0 | 0 |
| 6th | 13 | 0 | 0 |
| 5th | 10 | 0 | 0 |
| 4th | 16 | 11 | 0 |
| 3rd | 17 | 2 | 0 |
| 2nd | 16 | 0 | 0 |
| 1st | 13 | 2 | 0 |
*Total case numbers include both confirmed and probable COVID-19 cases as per the national case definition.
Negative numbers will indicate a reversal of a previous probable case when found to be negative on further testing.
Queensland COVID-19 statistics: qld.gov.au/health
Monthly QLD COVID-19 Cases 2021.
Local= Locally Acquired Case.
O/seas=Overseas Arrival Case.
| Date | Local | O/seas | Deaths |
|---|---|---|---|
| Sep | – | – | – |
| Aug | 131 | 40 | 0 |
| Jul | 41 | 68 | 0 |
| Jun | 23 | 59 | 0 |
| May | 0 | 57 | 0 |
| Apr | 2 | 82 | 1 |
| Mar | 19 | 127 | 0 |
| Feb | 1 | 20 | 0 |
| Jan | 3 | 54 | 0 |
QLD COVID-19 Cases 2020.
Local= Locally Acquired Case
O/seas=Overseas Arrival Case
| Date | Local | O/seas | Deaths |
|---|---|---|---|
| Dec | -2* | 53 | 0 |
| Nov | 3 | 27 | 0 |
| Oct | 3 | 12 | 0 |
| Sep | 26 | 7 | 0 |
| Aug | 28 | 12 | 0 |
| Jul | 7 | 10 | 0 |
| Jun | -1* | 10 | 0 |
| May | 5 | 20 | 0 |
| Apr | 70 | 182 | 3 |
| Jan-Mar | 164 | 617 | 3 |
| 2020 | 303 | 950 | 6 |
