The movement of the British Pound against the Australian Dollar during 2010.
The low point was 0.5513 on the 5th February 2010, with the highest point being 0.6141 on 6th May 2010.
This has shown a change of 11.39% between the two extremes, but the change from the first day of 2010 (0.5575) and the date of this article, 14th May 2010 (0.5745), the change has been 3.05%.
| GBP to the AUD | Date | AUD – GBP |
| 0.5575 | 4/01/2010 | 1.79 |
| 0.5678 | 5/01/2010 | 1.76 |
| 0.5717 | 6/01/2010 | 1.75 |
| 0.5765 | 7/01/2010 | 1.73 |
| 0.5742 | 8/01/2010 | 1.74 |
| 0.5788 | 11/01/2010 | 1.73 |
| 0.5763 | 12/01/2010 | 1.74 |
| 0.5706 | 13/01/2010 | 1.75 |
| 0.5707 | 14/01/2010 | 1.75 |
| 0.5676 | 15/01/2010 | 1.76 |
| 0.5655 | 18/01/2010 | 1.77 |
| 0.5631 | 19/01/2010 | 1.78 |
| 0.5624 | 20/01/2010 | 1.78 |
| 0.5616 | 21/01/2010 | 1.78 |
| 0.5570 | 22/01/2010 | 1.80 |
| 0.5629 | 25/01/2010 | 1.78 |
| 0.5592 | 27/01/2010 | 1.79 |
| 0.5566 | 28/01/2010 | 1.80 |
| 0.5523 | 29/01/2010 | 1.81 |
| 0.5536 | 1/02/2010 | 1.81 |
| 0.5521 | 2/02/2010 | 1.81 |
| 0.5533 | 3/02/2010 | 1.81 |
| 0.5537 | 4/02/2010 | 1.81 |
| 0.5513 | 5/02/2010 | 1.81 |
| 0.5550 | 8/02/2010 | 1.80 |
| 0.5557 | 9/02/2010 | 1.80 |
| 0.5583 | 10/02/2010 | 1.79 |
| 0.5678 | 11/02/2010 | 1.76 |
| 0.5665 | 12/02/2010 | 1.77 |
| 0.5671 | 15/02/2010 | 1.76 |
| 0.5692 | 16/02/2010 | 1.76 |
| 0.5714 | 17/02/2010 | 1.75 |
| 0.5719 | 18/02/2010 | 1.75 |
| 0.5772 | 19/02/2010 | 1.73 |
| 0.5821 | 22/02/2010 | 1.72 |
| 0.5803 | 23/02/2010 | 1.72 |
| 0.5781 | 24/02/2010 | 1.73 |
| 0.5790 | 25/02/2010 | 1.73 |
| 0.5826 | 26/02/2010 | 1.72 |
| 0.5919 | 1/03/2010 | 1.69 |
| 0.6021 | 2/03/2010 | 1.66 |
| 0.6012 | 3/03/2010 | 1.66 |
| 0.5981 | 4/03/2010 | 1.67 |
| 0.5989 | 5/03/2010 | 1.67 |
| 0.6008 | 8/03/2010 | 1.66 |
| 0.6057 | 9/03/2010 | 1.65 |
| 0.6116 | 10/03/2010 | 1.64 |
| 0.6106 | 11/03/2010 | 1.64 |
| 0.6081 | 12/03/2010 | 1.64 |
| 0.6028 | 15/03/2010 | 1.66 |
| 0.6079 | 16/03/2010 | 1.65 |
| 0.6037 | 17/03/2010 | 1.66 |
| 0.6032 | 18/03/2010 | 1.66 |
| 0.6046 | 19/03/2010 | 1.65 |
| 0.6112 | 22/03/2010 | 1.64 |
| 0.6080 | 23/03/2010 | 1.64 |
| 0.6120 | 24/03/2010 | 1.63 |
| 0.6117 | 25/03/2010 | 1.63 |
| 0.6115 | 26/03/2010 | 1.64 |
| 0.6087 | 29/03/2010 | 1.64 |
| 0.6123 | 30/03/2010 | 1.63 |
| 0.6072 | 31/03/2010 | 1.65 |
| 0.6027 | 1/04/2010 | 1.66 |
| 0.6055 | 6/04/2010 | 1.65 |
| 0.6076 | 7/04/2010 | 1.65 |
| 0.6094 | 8/04/2010 | 1.64 |
| 0.6069 | 9/04/2010 | 1.65 |
| 0.6030 | 12/04/2010 | 1.66 |
| 0.6014 | 13/04/2010 | 1.66 |
| 0.6041 | 14/04/2010 | 1.66 |
| 0.6020 | 15/04/2010 | 1.66 |
| 0.6036 | 16/04/2010 | 1.66 |
| 0.6026 | 19/04/2010 | 1.66 |
| 0.6062 | 20/04/2010 | 1.65 |
| 0.6057 | 21/04/2010 | 1.65 |
| 0.6006 | 22/04/2010 | 1.67 |
| 0.6001 | 23/04/2010 | 1.67 |
| 0.5990 | 27/04/2010 | 1.67 |
| 0.6041 | 28/04/2010 | 1.66 |
| 0.6103 | 29/04/2010 | 1.64 |
| 0.6065 | 30/04/2010 | 1.65 |
| 0.6064 | 3/05/2010 | 1.65 |
| 0.6052 | 4/05/2010 | 1.65 |
| 0.6009 | 5/05/2010 | 1.66 |
| 0.5991 | 6/05/2010 | 1.67 |
| 0.6048 | 7/05/2010 | 1.65 |
| 0.6081 | 10/05/2010 | 1.64 |
| 0.6051 | 11/05/2010 | 1.65 |
| 0.5984 | 12/05/2010 | 1.67 |
| 0.6057 | 13/05/2010 | 1.65 |
| 0.6141 | 14/05/2010 | 1.63 |
| 0.6112 | 17/05/2010 | 1.64 |
| 0.6046 | 18/05/2010 | 1.65 |
| 0.5981 | 19/05/2010 | 1.67 |
| 0.5794 | 20/05/2010 | 1.73 |
| 0.5745 | 21/05/2010 | 1.74 |
| 22/05/2010 | ||
| 23/05/2010 | ||
| 24/05/2010 | ||
| 25/05/2010 | ||
| 26/05/2010 | ||
| 27/05/2010 | ||
| 28/05/2010 | ||
| 29/05/2010 | ||
| 30/05/2010 | ||
| 31/05/2010 |
All rates taken at 4pm Australian Eastern Time
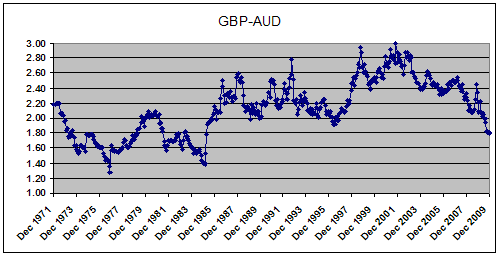
This chart showing the monthly FX rates from 1972 to 2009, shows how many Australian Dollars the British Pound was able to get on average.
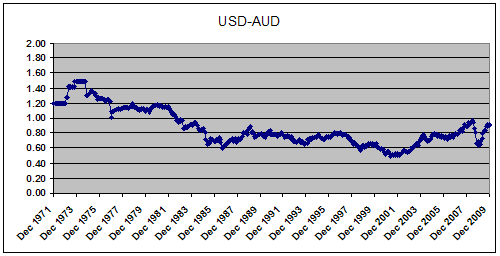
A comparison to the US Dollar for the same time frame is:


