Have Sydney House Prices Really Boomed?.
To answer that we need to define what a Boom is.
From the Cambridge Dictionary: “A housing boom is a time when the price of houses rises quickly“.
From Wikipedia: “A land boom is the rapid increase in the market price of real property such as housing until they reach unsustainable levels and then decline.”
Checking the changes in Median House prices in a few parts of Sydney, and averaging the annual price rises, we see an increase, but maybe not a boom.
For example…
Average Annual Increases in Sydney Median Property Prices.
From June 2009 to June 2019:
6.64% Cronulla in East Sydney
7.03% Seven Hills in West Sydney
7.04% Vaucluse in East Sydney
7.07% Belmore in West Sydney
7.41% Castle Hill in East Sydney
7.59% Parramatta in West Sydney
7.73% Penrith in West Sydney
7.88% Liverpool in West Sydney
8.04% Campsie in East Sydney
8.71% Chatswood in East Sydney
Why do people say Sydney House Prices have boomed?.
Because some of them have risen by a really large number.
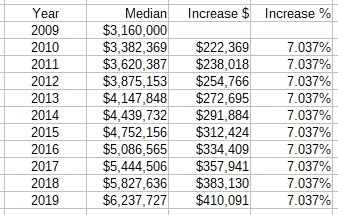
For example the Median price in Vaucluse, East Sydney, has gone from $3,160,000 to $6,237,500. An increase of $3,077,500 over ten years. But.. when we check the average annual rise, we see only 7.04% per year.
Difficult to believe?
This is the calculation to show the change if it was the same increase each year.
Vaucluse, East Sydney with an annual rise of 7.037%
However, Penrith, West Sydney, rose even faster, with an annual average increase of 7.73%. But with a much smaller median dollar value for properties, rising from $285,000 to $600,000. An increase of $315,000 over ten years.
